Functional foods – Market data
|
Functional Foods Market by Region 2006/2009  Discover B2B Marketing That PerformsCombine business intelligence and editorial excellence to reach engaged professionals across 36 leading media platforms. |
||||
|---|---|---|---|---|
| 2006e (US$m) | 2009e (US$m) | % change 2006-2009 | % share 2009 | |
| Japan | 6345 | 8980 | 41.5 | 39.2 |
| USA | 5755 | 7123 | 23.8 | 31.1 |
| Europe | 5058 | 6454 | 27.6 | 28.1 |
| Australia | 284 | 366 | 28.9 | 1.6 |
| Total | 17442 | 22923 | 31.4 | 100 |
(not including energy and mood enhancing foods and beverages)
Source: Leatherhead Food Research: Future Directions in Functional Foods (July 2010)
For more information on this report go to:-
https://www.just-food.com/market-research/future-directions-in-functional-foods_id93362.aspx?lk=pl

US Tariffs are shifting - will you react or anticipate?
Don’t let policy changes catch you off guard. Stay proactive with real-time data and expert analysis.
By GlobalData
Source: Leatherhead Food Research: Future Directions in Functional Foods (July 2010)
For more information on this report go to:-
https://www.just-food.com/market-research/future-directions-in-functional-foods_id93362.aspx?lk=pl

Source: Leatherhead Food Research: Future Directions in Functional Foods (July 2010)
For more information on this report go to:-
https://www.just-food.com/market-research/future-directions-in-functional-foods_id93362.aspx?lk=pl

Source: Key Note: Functional Foods Market Report 2010
For more information on this report, go to:-
https://www.just-food.com/market-research/functional-foods-2010_id93791.aspx?lk=pl
| Global probiotics market by sector, 2003-2008 (US$m and %) | ||||||
|---|---|---|---|---|---|---|
| 2003 | 2004 | 2005 | 2006 | 2007 | 2008 | |
| Foods (US$m) | 7000 | 8500 | 10200 | 11200 | 12500 | 14350 |
| Percentage change (%) | – | 21.4 | 20 | 9.8 | 11.6 | 14.8 |
| Supplements (US$m) | 840 | 920 | 1030 | 1140 | 1250 | 1355 |
| Percentage change (%) | – | 9.5 | 12 | 10.7 | 9.6 | 8.4 |
| Total (US$m) | 7840 | 9420 | 11230 | 12340 | 13750 | 15705 |
| Percentage change (%) | – | 20.2 | 19.2 | 9.9 | 11.4 | 14.2 |
Source: just-food: Global market review of probiotics – forecasts to 2013
For more information on this report go to:-
| Leading probiotic dairy markets by country/region, 2008 (US$m) | |||
|---|---|---|---|
| Yoghurt | Probiotic drinks | Total | |
| Spain | 460 | 590 | 1050 |
| Germany | 145 | 595 | 740 |
| Italy | 225 | 450 | 675 |
| US | 525 | 125 | 650 |
| France | 425 | 225 | 650 |
| UK | 200 | 415 | 615 |
| Netherlands | 75 | 155 | 230 |
| Australia | 60 | 70 | 130 |
| Canada | 55 | 20 | 75 |
| Asia Pacific | 4200 | 2300 | 6500 |
| Latin America | 570 | 1075 | 1645 |
| Total | 6940 | 6095 | 12960 |
Source: just-food: Global market review of probiotics – forecasts to 2013
For more information on this report go to:-
https://www.just-food.com/market-research/global-market-review-of-probiotics-forecasts-to-2013_id81280.aspx?lk=pl

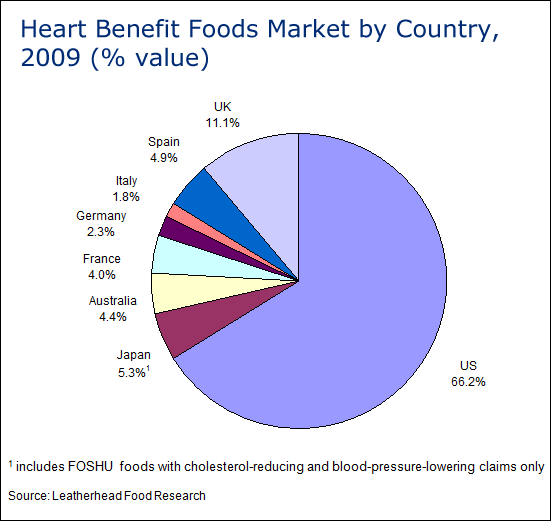
Source: Leatherhead Food Research: The market for heart benefit foods October 2009
For more information on this report go to to:-
https://www.just-food.com/market-research/the-market-for-heart-benefit-foods-3rd-edition_id83024.aspx?lk=pl


